Representing Landscapes
Michael Smith
|
|
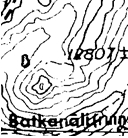
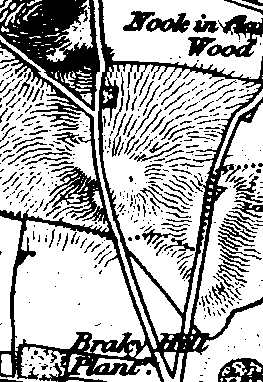
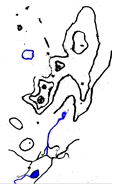
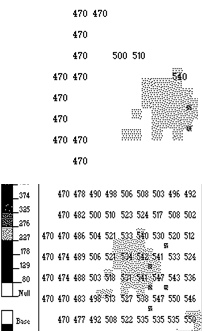
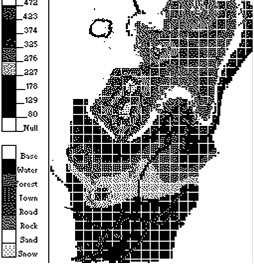
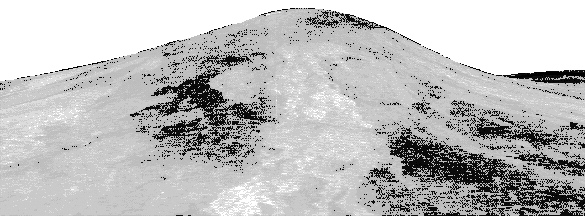
Anaximander (c611-547 BC), is credited with inventing cartography, producing the first world map and thus giving Greek shipping a distinct advantage. Maritime cartographers are only interested in depths when they get small enough to impinge on their hulls or keels. For their terrestrial cousins though the representation of the varying heights of hills and mountains, and the depths of valleys and gorges as they appear on a topographic map, known as relief, is a thorny problem. Unless the relief is adequately represented, the map does not give a clear picture of the area it represents. In the earliest maps, relief was often indicated pictorially by small drawings of mountains and valleys, but this method is extremely inaccurate and has been generally supplanted by a the familiar system of contour lines. Other ways of indicating relief include the use of colours, hachures or shading. Hachures, short parallel lines, are used to show slopes and are made heavier and closer together for steeper slopes. Shadings or carefully drawn hachures, are more easily interpreted than contour lines. Some of our best maps use a combination of contours to give accurate elevations, and shading on south and east facing slopes. They give the impression, at first glance, of a landform illuminated from the north-east. An alternative way of illustrating the lie of the land is through a pictorial representation of the ground as seen from a point in space, viewing the scene obliquely. Conventionally this is illuminated from the right hand side. On occasions nature conveniently provides a suitable mountain from which to photograph or sketch such a view. Usually this is not possible and in such cases a similar effect can be achieved using landscaping software[1] on a computer. The remainder of this article outlines the use of such a computer program to produce an easily understood representation of land shape. Inevitably the representation is hampered by the absence of colour in the illustrations[2]. Start with a sketch map, in this case the land behind Low Hall Garth, and a few contours. These are scanned into a computer file and imported into the landscape program. This sketch is used as a background over which contours can be traced and spot heights set. This enlarged example is a spot height and a contour near a peak. The grey areas are the sketch map marks of the background. The computer is then set to interpolate the heights between the known heights. Obviously for this to be reasonably accurate the peaks, cols and a large number of spot heights need to have been marked in along with some contours to give the shape of the land. Interpolation sets a height at every grid point, say 50m to 200m apart. What started off as a sketch has now become a matrix of heights. To these are added, for each grid point, the terrain type which can be set as rock, vegetation, building, road, snow, glacier, water, etc. Each of these carries a colour or colours. Where multiple colours are used these indicate the appearance when that terrain is lit from different angles or during different seasons. The most sophisticated programs also assign information on texture and movement for each terrain. The view of this ‘map’ can be generated and the lighting, viewing position, season and scales varied. Such maps can be generated not only from sketches but from data collected from satellites which measure directly the topography and land use. Their representation on paper, even in colour is a poor substitute for seeing the image on a screen. Add to this real time movement through the image and you have a whole new approach to route planning. It is a long way from Anaximander and his first world map to this virtual world. It was the Greek’s failure to develop their technology on a par with theoretical knowledge and their wide-ranging speculations which limited them. We now have the technology, do we have the need and vision to use it in mountaineering? Anaximander also postulated the origin of the universe as the separation of hot from cold, and dry from wet, in the primordial material, forming a cylindrical Earth, and held that all things eventually return to their original elemental state. So perhaps we ought to be wary of him and developments based on his work! |
[1] One such piece of shareware software is Landscape Explorer for Windows produced by WolleySoft, operating from Humblesknowe Cottage, Ramoyle, Perthshire, FK15 0BA.
It costs £40 to register for full use.
[2] Web Note: The journal at this time was only printed greyscale, however the original files have some colour images, which which have been included here.


